Important Topics from Stats and ML
Random Variable
- which maps the output of a random experiment to a numerical value
- Radom Experiment Example: tossing a coin
Expected Value
- average value of radom variable in the long run
Probability
- sum of all probabilities in an experiment is equal to 1
Inferential Statistics
- It is difficult to read the behavior of the complete population due to time and cost issue
- We can use inferential statistics where we infer information about population from sample
- Example: Lead content in Maggi Packets
Central Limit Theorem
- Sampling distribution mean is the mean of sample means
- Number of units in every sample is called sample size
-
The sampling distribution Mean = Population Mean
- Standard Error =
- If , sammpling distribution is assumed to be normally distributed
Confidence Interval
Hypothesis Testing
- Hypothesis: A claim or an assumption \thetaat we make about one or more population parameters
-
Types of Hypothesis:
-
Null Hypothesis ()
- makes an asummption about the status quo
- always contains the symbols
-
Alternate Hypothesis ()
- challenges and complements the null hypothesis
- always contains the symbols
-
- are disjoint events
Upper Tailed Test
- The critical region lies on the right side of the distribution
- The alternate hypothesis contains < symbol
- If alpha is 0.5, p-value = 0.95
Lower Tailed Test
- The critical region lies on the left side of the distribution
- The alternate hypothesis contains > symbol
- If alpha is 0.5, p-value = 0.05
Two Tailed Test
- The critical region lies on both sides of the distribution
- The alternate hypothesis contains symbol
- If alpha is 0.5, p-value range (cumulative over sections): [0, 0.025, 50, 0.975, 1]
Exploratory Data Analysis
-
Types of Data
- Public Data: data collected by the government or other public agencies that are made public for the purposes of research are known as Public data
- Private Data: Data generated by Banking, telecom, retail and media are some examples of private data. This data cannot be used freely for analysis
-
Univariate
- Analyzing one variable at a time
- historgram, countrplot, boxplot
-
Bivariate
- Analyzing two variables at a time
- scatterplot, barplot, boxplot, pairplot
-
Multivariate
- Analyzing more than two variables at a time
- barplot, scatterplot, boxplot
- Outlier Analysis
-
Categorical Data
- discrete values
-
Continuous Data
- range of values
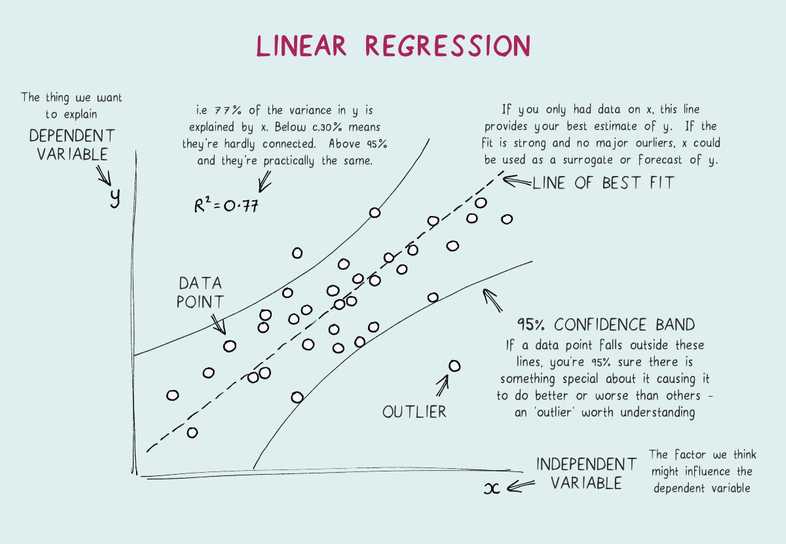
Linear Regression
- It is the simplest form of regression. It is a technique in which the dependent variable is continuous in nature. The relationship between the dependent variable and independent variables is assumed to be linear in nature.
- Simple Linear Regression - one independent variable
- Multiple Linear Regression - more than one independent variable
- Out of total variance how much is explained by the model
RSS
- how much target value varies around the regression line
Adjusted
- contains effect of data size
- N = Number of Rows
- P = number of Features
Logistic Regression
- Sigmoid Curve ranges from 0 to 1
- Log Odds =
- Odds =
Naive Bayes
- based on Bayes theorem
Important Topics
- Expected Values
- Mean, Median, Mode
- Probability
- CLT
- hypothesis formulation
- EDA graph based questions
- R^2, Adj R^2, y=mx+c
- odds:
- sigmoid
- recall, precision, specificity, sensitivity, confusion matrix
- precision: out of all the 0s you "PREDICTED" (TP+FP), how many are actually zero (TP)
- recall: out of all the 0s there actually are (TP+FN), how many you predicted correctly (TP)
